|
Key figures |
2013 1 |
2014 |
2015 |
2016 2 |
2017 |
2018 |
2019 |
2020 |
2021 |
2022 |
|---|---|---|---|---|---|---|---|---|---|---|
|
Result |
||||||||||
|
in € millions |
|
|
||||||||
|
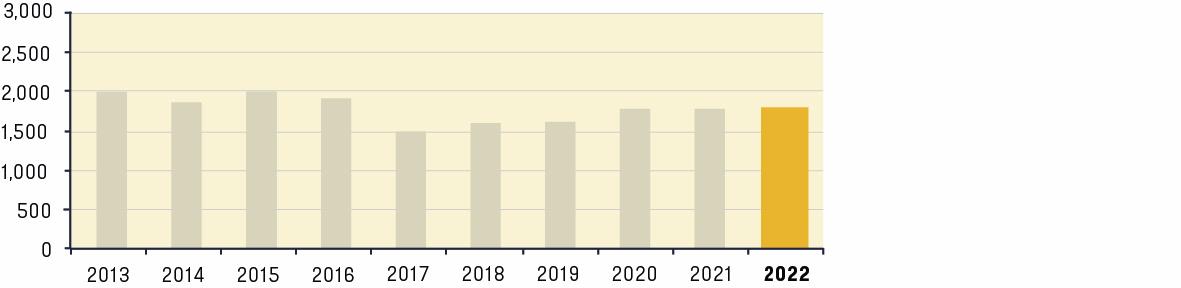
Revenue |
2,001 |
1,868 |
1,979 |
1,884 |
1,487 |
1,579 |
1,600 |
1,746 |
1,748 |
1,812 |
|
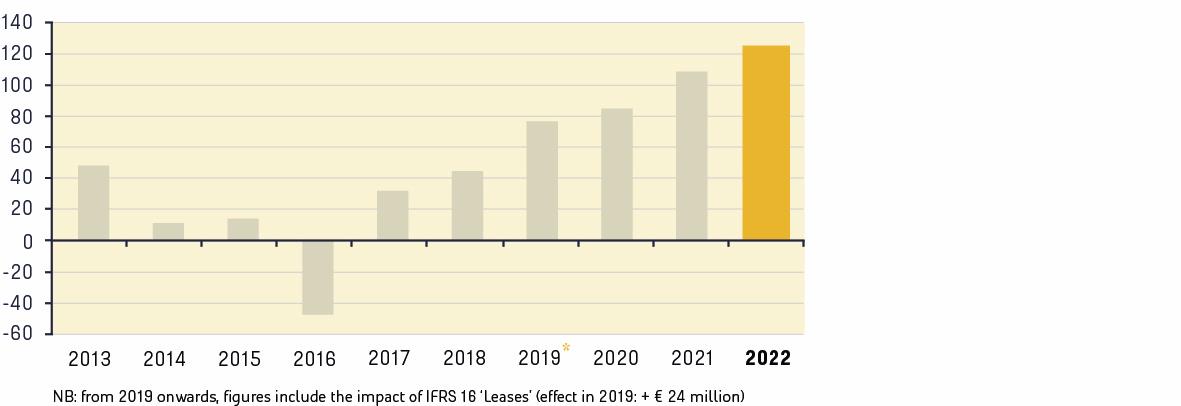
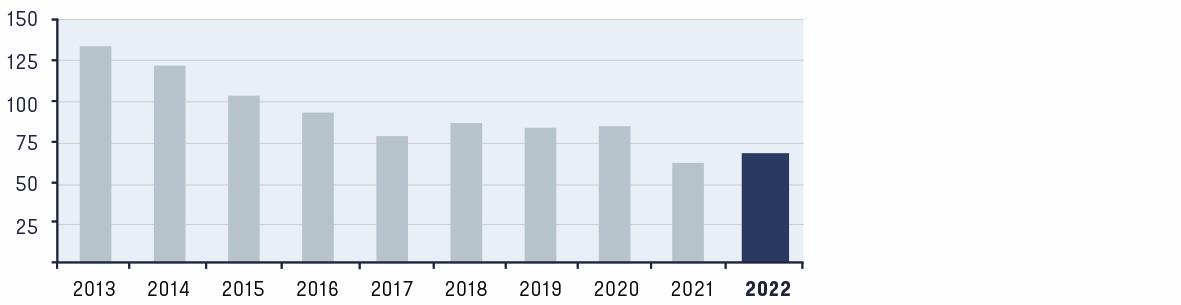
Underlying EBITDA 4 |
47 |
11 |
14 |
-47 |
31 |
43 |
78 |
85 |
106 |
126 |
|
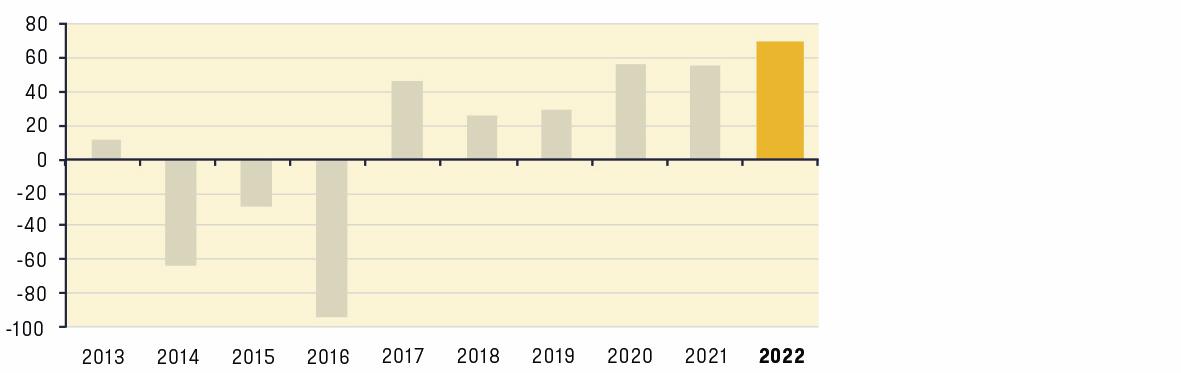
Operating result |
11.9 |
-63.5 |
-29 |
-94 |
45.3 |
22.6 |
29.2 |
55.7 |
55.2 |
70.9 |
|
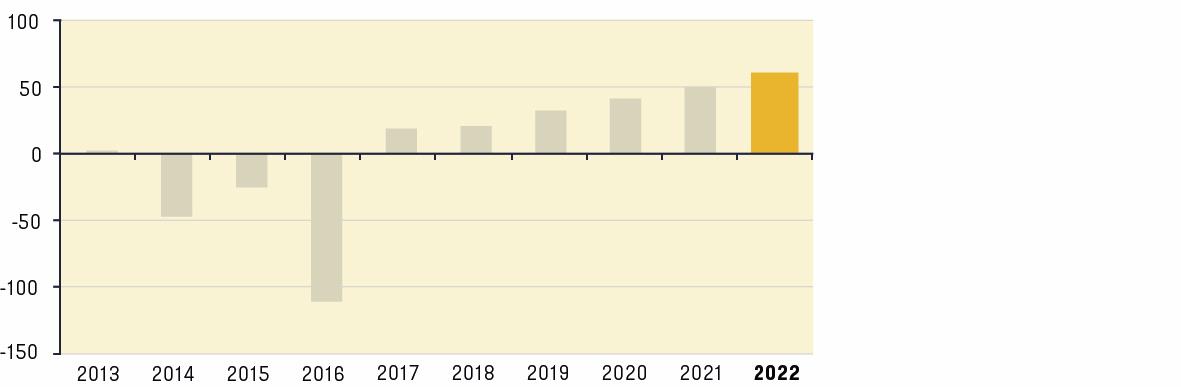
Result after tax |
1.9 |
-47.3 |
-27.3 |
-110.5 |
19.5 |
20.5 |
30.1 |
40.1 |
50.3 |
59.6 |
|
Capital |
||||||||||
|
in € millions |
|
|
||||||||
|
Assets |
1,203 |
1,205 |
1,190 |
1,056 |
771 |
776 |
898 |
931 |
991 |
1,083 |
|
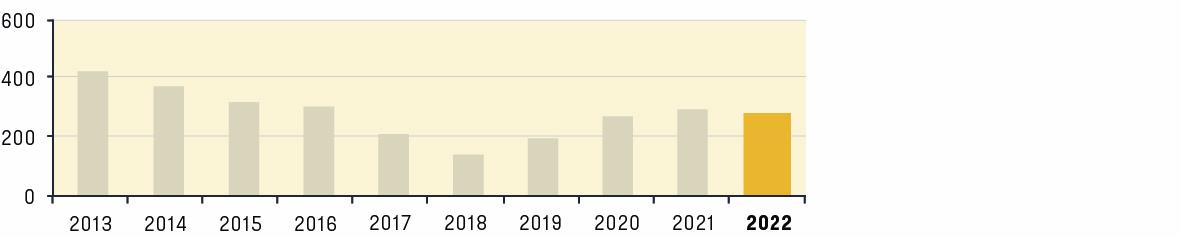
Average invested capital |
423 |
372 |
318 |
293 |
202 |
161 |
196 |
240 |
250 |
245 |
|
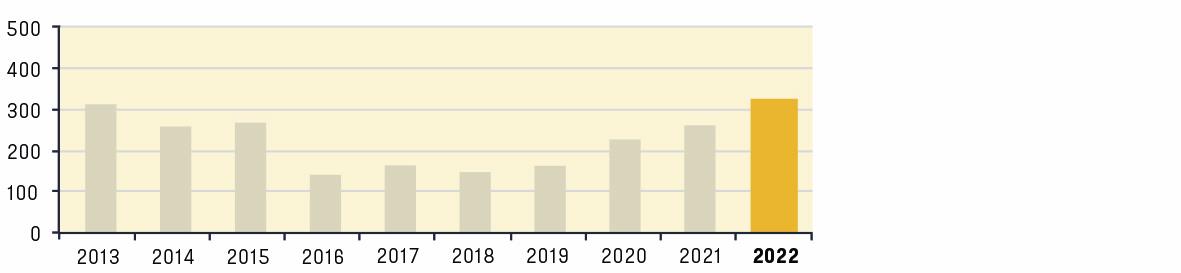
Equity capital |
313 |
259 |
266 |
142 |
162 |
149 |
178 |
226 |
268 |
317 |
|
Net debt |
66 |
31 |
10 |
146 |
-14 |
-31 |
30 |
-37 |
-91 |
-151 |
|
Cash flow |
||||||||||
|
in € millions |
|
|
||||||||
|
Operating |
-10 |
46 |
10 |
-68 |
21 |
27 |
42 |
128 |
109 |
110 |
|
Investment |
-3 |
-10 |
-9 |
-22 |
91 |
-10 |
4 |
-33 |
-32 |
-17 |
|
Financing |
8 |
-23 |
51 |
43 |
-116 |
-3 |
-26 |
-29 |
-42 |
-66 |
|
Cash flow |
-5 |
13 |
52 |
-47 |
-4 |
14 |
20 |
66 |
35 |
27 |
|
Ratios |
||||||||||
|
in % |
|
|
||||||||
|
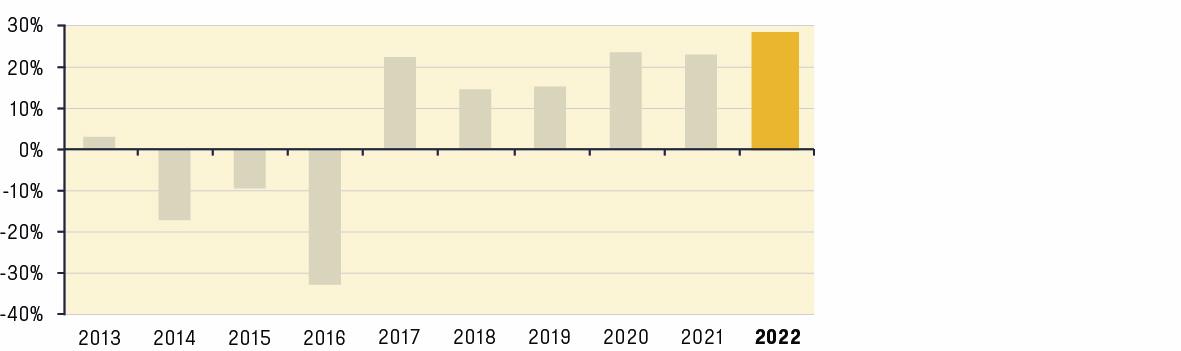
Return on average capital |
2.8 |
-17.1 |
-9.1 |
-32.1 |
22.5 |
14.1 |
14.8 |
23.2 |
22.1 |
28.9 |
|
Result after tax: |
|
|
||||||||
|
- as % of equity |
0.6 |
-18.3 |
-10.2 |
-77.8 |
12 |
13.8 |
16.9 |
17.7 |
18.8 |
18.8 |
|
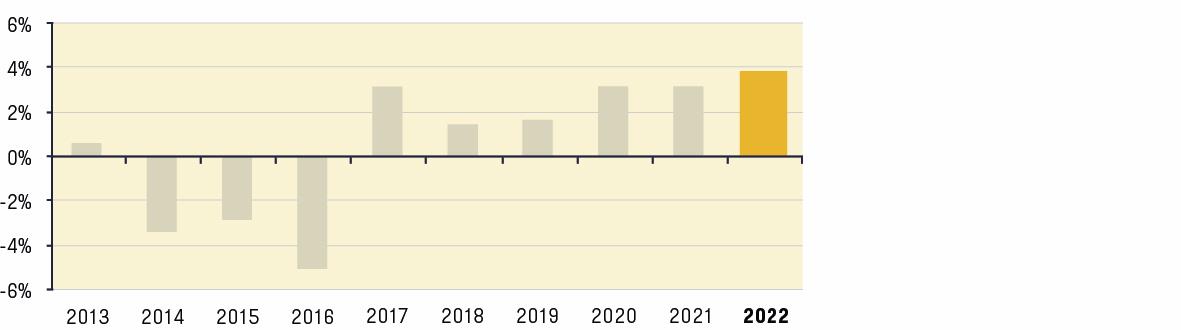
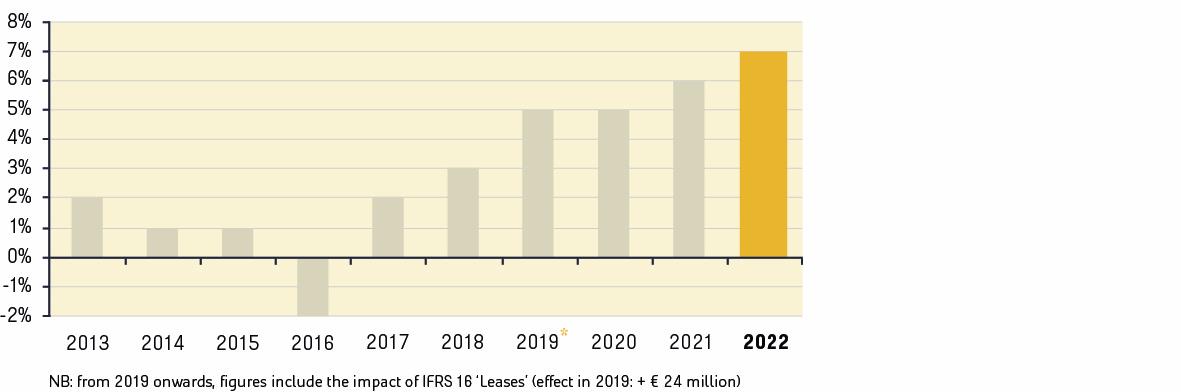
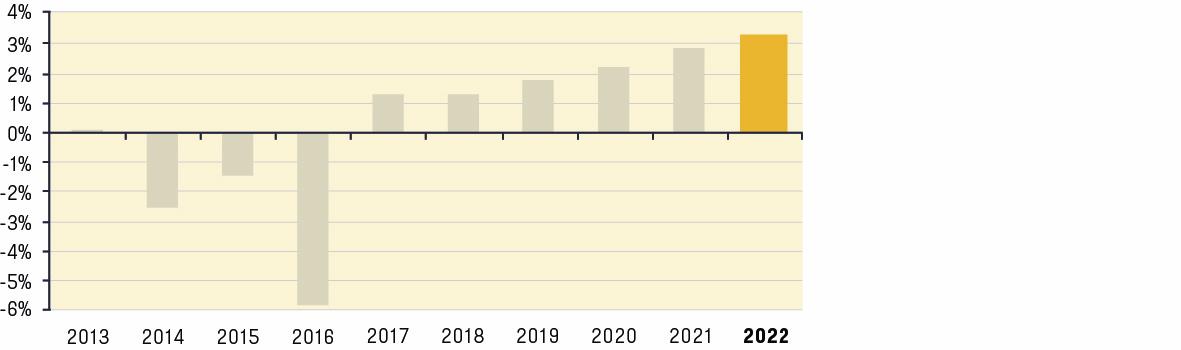
- as % of revenue |
0.1 |
-2.5 |
-1.4 |
-5.9 |
1.3 |
1.3 |
1.9 |
2.3 |
2.9 |
3.3 |
|
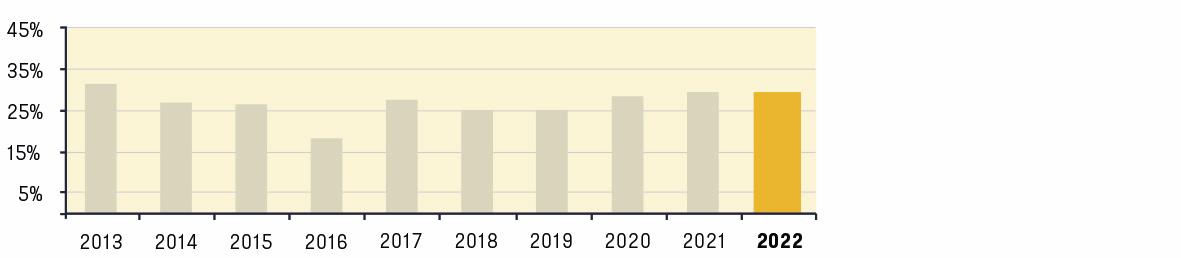
Solvency rate based on guarantee capital |
31.5% |
27.0% |
26.1% |
17.7% |
26.8% |
25.0% |
24.8% |
28.8% |
30.1% |
29.3% |
|
No. of shares |
||||||||||
|
x 1.000 |
|
|
||||||||
|
At year-end |
19,349 |
19,461 |
21,407 |
21,407 |
21,409 |
21,409 |
21,409 |
21,933 |
22,760 |
23,553 |
|
Average |
18,111 |
19,420 |
20,661 |
21,407 |
21,408 |
21,409 |
21,409 |
21,715 |
22,415 |
23,223 |
|
Data per share3 |
|
|
|
|
|
|
|
|
|
|
|
x € 1 |
|
|
||||||||
|
Equity |
17.28 |
13.34 |
12.87 |
6.63 |
7.57 |
6.96 |
8.31 |
10.41 |
11.96 |
13.65 |
|
Operating result |
0.66 |
-3.27 |
-1.4 |
-4.39 |
2.12 |
1.06 |
1.35 |
2.56 |
2.46 |
3.05 |
|
Result after tax |
0.1 |
-2.44 |
-1.32 |
-5.16 |
0.91 |
0.96 |
1.4 |
1.85 |
2.24 |
2.57 |
|
Dividend |
0.15 |
- |
- |
- |
- |
- |
- |
0.73 |
0.88 |
1.01 |
|
Share price information |
||||||||||
|
x € 1 |
|
|
||||||||
|
At year-end |
10.51 |
8.95 |
8.18 |
5.52 |
9.71 |
8 |
7.5 |
9.33 |
14.9 |
10.12 |
|
High price |
10.78 |
14.2 |
13.36 |
9.2 |
10.87 |
12.92 |
11.52 |
9.67 |
15.4 |
15.70 |
|
Low price |
6.85 |
7.83 |
5.77 |
4.59 |
6.02 |
7.44 |
7.12 |
4.47 |
9.26 |
9.19 |
|
Other data |
||||||||||
|
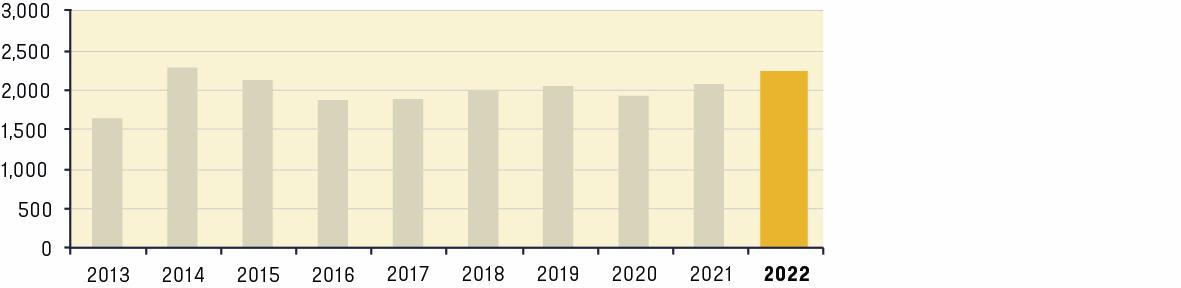
Order book (* in € millions) |
1,643 |
2,287 |
2,094 |
1,863 |
1,898 |
2,014 |
2,124 |
1,946 |
2,061 |
2,358 |
|
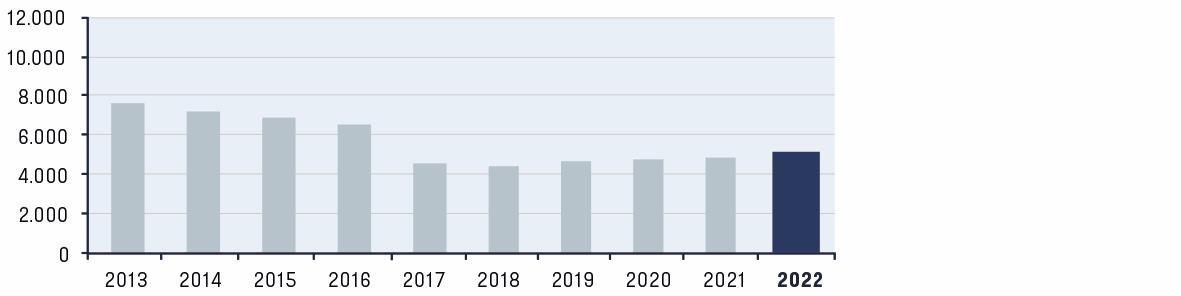
Employees (average number of FTEs) 5 |
7,617 |
7,198 |
6,808 |
6,412 |
4,520 |
4,483 |
4,565 |
4,678 |
4,706 |
4,815 |
-
After revision due to change in system joint arrangements.
-
The figures in the income statement cover all operations (incl. discontinued operations). Balance sheet figures are before reclassification of sold entities to assets held for sale excluding total assets. Net debt and the order book are after reclassification of sold entities to assets held for sale.
-
Data per share are expressed relative to the weighted average number of ordinary shares. Dividend per share is based on the number of ordinary shares at year-end.
-
Underlying EBITDA is the operating result before depreciation and amortisation, including the EBITDA from joint ventures, excluding property impairments, reorganisation costs, book results on the sale of entities and other non-operating results designated as exceptional by the group. As a result of the introduction of IFRS 16 'Leases', there has been a shift from operating expenses to depreciation. In addition, part of the operating costs has been shifted to finance costs. As a result, underlying EBITDA increased by € 24 million in 2019, the first year of IFRS 16 adoption.
-
Of the total number of employees, around 14.2% are women, 13.7% work part time and 97.8% have an open-ended contract. In addition, Heijmans hired around 585 FTEs in 2022, while the use of temporary staff increased by around 20%. The data are from the HR system (SAP and Workday).
Financial key figures
Revenue (in € mln.)
Order book (in € mln.)
Operational result (in € mln.)
Operational margin (in %)
Underlying EBITDA (in € mln.)
Underlying EBITDA margin (in %)
Result after taxes (in € mln.)
Net margin (in %)
Average invested capital (in € mln.)
Return on average invested capital (in %)
Equity (in € mln.)
Solvency on the basis guarantee equity (in %)
Non-financial key figures
Average number of employees (in FTEs)
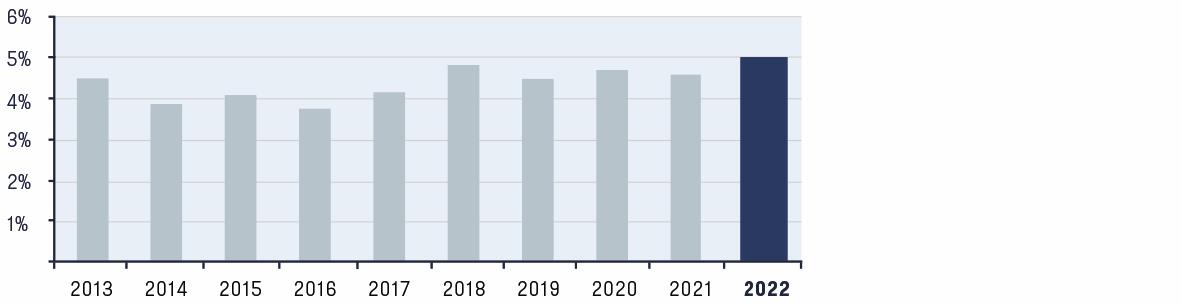
Absenteeism (in %)
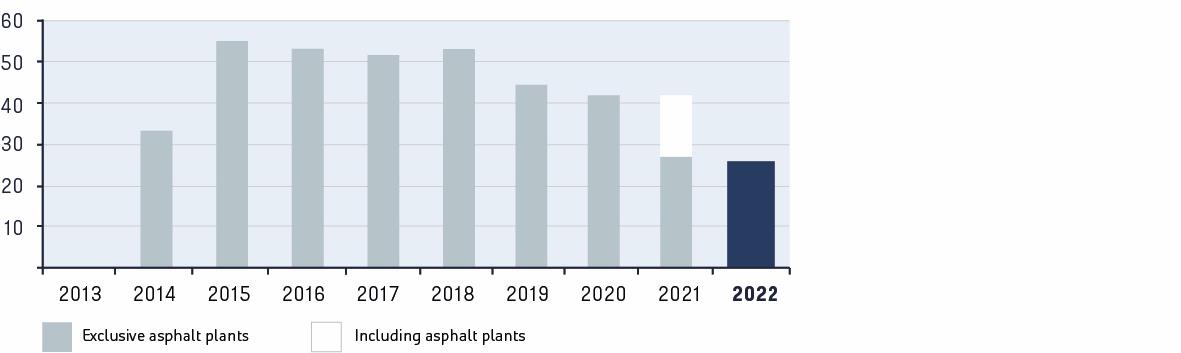
CO2 emissions scope 1+2 *
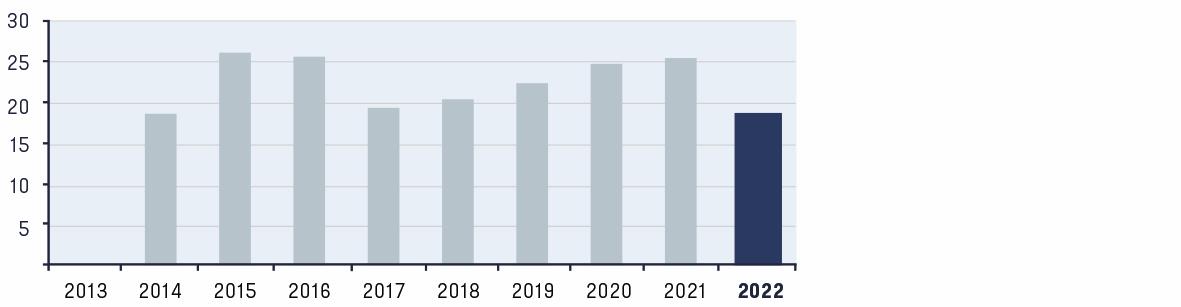
Total amount of waste materials (in tonnes) *
Number of accidents (incl. subcontractors)
- *We do not have data going back 10 years for any these key figures: we report on the years for which data are available. Any definition changes in the reported period are explained in more detail in the KPI table in the appendices.
- **In 2022, CO2 emissions are reported excluding the divested asphalt plants.
Working in engineering
Getting young people excited about a career in engineering is important to us. A lot of parents want their children to study, but many young people prefer to work with their hands. For example, they want to design systems or technical installations, or make them themselves. This is a tangible result you can be proud of, and we can certainly guarantee you’ll always have plenty of work. At Heijmans, young employees are given every opportunity to learn and grow. To bring technology to the attention of children and young people, we like to work with educational institutions in secondary and higher vocational education and all kinds of other partners. This is how Heijmans hopes to kindle the flame for technology in an ever-growing group of children and young people. Because a technical education is a guarantee of a good job and a good future.
Watch the video 'Werken in de techniek is leuk' (Dutch version only)